


[vc_row][vc_column][vc_column_text]
Tracking 2020 Q3 Report | or January, February and March 2020
[vc_row][vc_column][vc_column_text]
Under the Paris Agreement, the Australian Government has legally committed to reducing our emissions by 26-28% below 2005 levels by 2030. However, to ensure global warming remains under 2 degrees, independent body – the Climate Change Authority (CCA) – has proposed Australia set a national Science Based Target (SBT). This is a target calculated from Australia’s share of emissions for a 2◦C global outcome. Ndevr Environmental has used this target to model a quarterly emissions budget for Australia.
This report tracks Australia’s performance against our Paris target and the CCA’s carbon budget based on the latest available data, trends and industry movements for the months of January, February and March (Q3/FY2020). Our results are presented in tonnes of carbon dioxide equivalents (t CO2-e). 1 t CO2-e is roughly equal to the emissions of a standard 5-seat passenger vehicle driving around 5,400 km.[/vc_column_text][/vc_column][/vc_row][vc_row][vc_column][vc_column_text]
Headline Results
[/vc_column_text][/vc_column][/vc_row][vc_row][vc_column][vc_column_text]
- The COVID-19 pandemic has had a dramatic impact on emissions for the quarter, even though economic activity only really slowed in March.
- Emissions for the 12-month period to 31 March 2020 declined by around 1.2% on the previous 12-month period.
- If emissions continue to decline at a rate of 1.2% p.a., the 2030 Paris target would be met around 2035, 5 years after the deadline. This is a significant improvement from the previous two quarters’ trajectories, where their respective decline rates saw us hitting our Paris target at 2098 and 2065.
- While electricity emissions for Q3/FY2020 are the lowest on record (dating back to 2002), stationary energy emissions are trending upward.
- Renewable energy generation across the NEM states for the period had the third highest penetration rate on record.
- Emissions for Q3/FY2020 are projected to be 128.2 Mt CO2-e. This represents a reduction of 3.8 Mt CO2-e on the corresponding quarter the year prior (Q3/FY2019).
[/vc_column_text][/vc_column][/vc_row][vc_row][vc_column][vc_column_text]
COVID-19 Related Impacts for April
[/vc_column_text][/vc_column][/vc_row][vc_row][vc_column][vc_column_text]We have conducted some additional analysis on available data month-by-month and beyond quarter’s end and found:
- Aviation fuel use in March 2020 decreased by 225 ML and 0.6 MtCO2-e, and 602 ML and 1.6 MtCO2-e for April 2020, a 29% and 80% decrease respectively against 2019. The April reduction in emissions alone is roughly equivalent to taking 662,000 cars off the road for 12 months.
- A significant decrease in automotive transport fuels in April 2020 (see Real-world Effects – Looking Back on the COVID-19 Response for graphics), including:
- 7 ML (41%) reduction in LPG consumption compared to April 2019,
- 4 ML (43%) reduction in gasoline consumption compared to April 2019, and
- 9 ML (10%) reduction in diesel consumption compared to April 2019.
The figures for automotive transport fuel show commuters have drastically reduced their light vehicle fuel consumption as they work from, and stay at home more. Diesel consumption from heavy freight vehicles and commercial activities however have seen a lesser reduction as road and rail freight have been required to keep commodities moving across the economy.[/vc_column_text][/vc_column][/vc_row][vc_row][vc_column][vc_column_text]
Australia’s Quarterly Emissions Projections to a 2 Degree Target
[/vc_column_text][/vc_column][/vc_row][vc_row][vc_column][vc_single_image image=”32165″ img_size=”full” alignment=”center”][vc_column_text]
Figure 1: Australia’s Quarterly Emissions Projections to a 2 Degree Target, 2005 – 2050
[/vc_column_text][vc_single_image image=”32189″ img_size=”full” alignment=”center”][vc_column_text]
Figure 2: Australia’s Quarterly Emissions Projections to a 2 Degree Target, 2013 – 2020
[/vc_column_text][/vc_column][/vc_row][vc_row][vc_column][vc_column_text]
Detailed Findings
[/vc_column_text][/vc_column][/vc_row][vc_row][vc_column][vc_column_text]
Increased Renewable Generation Leads to Reduced Electricity Emissions
The National Electricity Market has achieved its third highest ever quarterly renewable energy penetration for Q3/FY2020, coming in at 23.9%, falling 1.4% below the all-time high which occurred last quarter. This contributed to a slight drop in electricity related emissions of 0.3 Mt CO2-e nationwide.
While total energy generation in the NEM has remained reasonably stable since 2005, rising renewable energy penetration has continued to produce a downward trend in emissions from the Australian electricity sector. However, this trend is somewhat counter acted by gradually rising stationary emissions.[/vc_column_text][vc_single_image image=”32167″ img_size=”full” alignment=”center”][vc_column_text]
Figure 3: Increasing Renewable Generation and Reducing Electricity Emissions
[/vc_column_text][vc_single_image image=”32168″ img_size=”full” alignment=”center”][vc_column_text]
Figure 4: Stationary Emissions Rise as Electricity Emissions Drop
[/vc_column_text][/vc_column][/vc_row][vc_row][vc_column][vc_column_text]
Electricity Analysis for the National Energy Market

Electricity emission projections for Q3/FY2020 were the lowest on record across the entire data set, dating back to 2001 (41.6 Mt CO2-e).
With quarterly electricity demand relatively stable across the NEM, the decline has been driven by an increase in renewable energy generation from wind power, hydro power, utility-scale solar and rooftop solar, as well as the COVID pandemic response to a lesser extent.
Renewable energy generation across the NEM states for the period was 23.9% (including rooftop solar), the third highest penetration rate on record for renewable energy.
Quarterly black coal and brown coal generation have risen by 1.04 TWh and 0.63 TWh respectively, contributing to a 76% fossil fuel penetration.
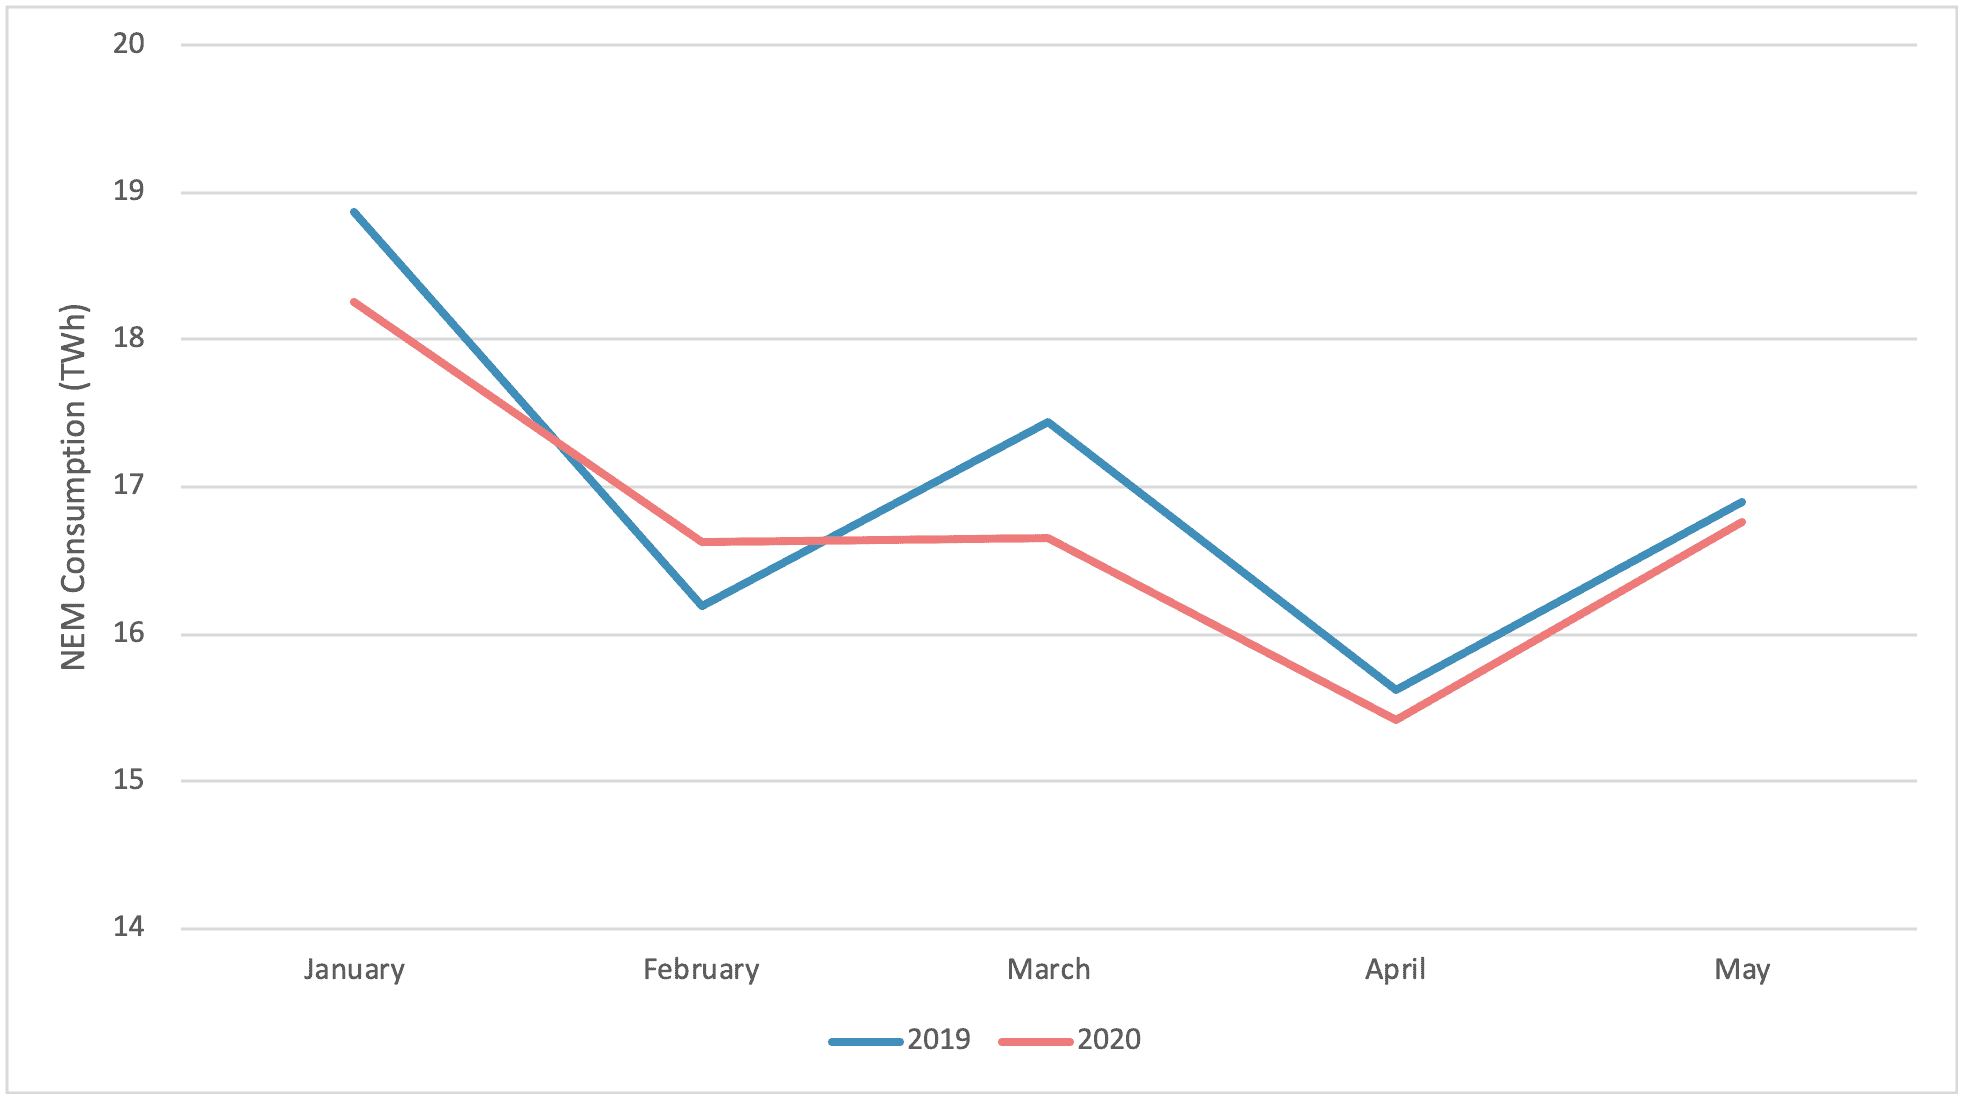
Electricity generation in the NEM for the month of March 2020 fell by 4.5% or 0.78 TWh below March 2019 levels.
For Q3/FY2020, results for the NEM states are as follows:
– NSW generated 17 TWh of electricity with 79% from black coal, 1% from gas and 19% from renewable sources including wind, hydro, utility-scale solar and rooftop solar. NSW’s renewable energy percentage has fallen short by 0.7% on its all-time high, which occurred last quarter.
– QLD generated 16.9 TWh of electricity with 75% from black coal, 12% from gas and the balance from renewable sources including hydro, utility-scale solar, rooftop solar and a small portion of wind energy. QLD’s renewable energy percentage decreased 2.2% on the previous quarter to equal its second highest rate of 12.9%.
– VIC generated 12.1 TWh of electricity with 74% from brown coal, 4% from gas and 22% from renewable sources including wind, hydro, rooftop solar and utility-scale solar. Victoria’s renewable energy penetration is its third highest on record, although brown coal generation has not been higher for a quarter since this time last year.
– SAgenerated 3.4 TWh of electricity with 40% from gas and 60% from renewable sources such as wind, rooftop solar, utility-scale solar and battery (discharge). South Australia’s renewable energy percentage has risen 1% on last quarter to reach its highest on record.
– TASgenerated 2.3 TWh of electricity with 99.7% from renewable sources such as hydro, wind and rooftop soar and the balance from gas. TAS’s renewable energy percentage is at its highest since June 2018 and has not dropped below 78% since records began (2005).[/vc_column_text][vc_row_inner][vc_column_inner][vc_column_text]

[/vc_column_text][/vc_column_inner][/vc_row_inner][/vc_column][/vc_row][vc_row][vc_column][vc_row_inner][vc_column_inner width=”1/2″][vc_column_text]
Australia’s Quarterly Emissions By Sector
[/vc_column_text][vc_column_text]

*Negative LULUCF sector emissions cannot be seen on the above chart[/vc_column_text][/vc_column_inner][vc_column_inner width=”1/2″][vc_column_text]
2 Degree Budget Expenditure to Date
[/vc_column_text][vc_column_text]

[/vc_column_text][/vc_column_inner][/vc_row_inner][vc_column_text]
Real-world Effects – Looking Back on the COVID-19 Response
With recent data becoming available it has been possible to observe some of the effects the COVID-19 pandemic response on energy use. Although emissions have not decreased at the rate initially expected, we have seen a significant decrease in aviation fuel use, with lesser effects reaching the NEM. Comparing the early months of the pandemic response with the same period from 2019 shows:
- Aviation fuel use in March 2020 decreased by 225 ML and 0.6 MtCO2-e, and 602 ML and 1.6 MtCO2-e for April 2020, a 29% and 80% decrease respectively. The April reduction in emissions alone is roughly equivalent to taking 662,000 cars off the road for 12 months.
- A decrease of 281.9 ML (domestic flights) and 593.8 ML (international flights) in aviation fuel use, totalling a reduction of 875.7 ML (28%) or 2.2 Mt CO2-e for the January to April periods,
- A decrease of 650 ML (4%) in automotive transport fuel use (including LPG, petroleum, ethanol and diesel) for the January to April periods, and
- A reduction in NEM generation of 1.29 TWh (2%) for the January to May periods, with March 2020 falling 0.78 TWh (4.5%) below March 2019 levels.
[/vc_column_text][vc_single_image image=”32173″ img_size=”full” alignment=”center”][vc_column_text]
Figure 9: Aviation Fuel Consumption During COVID-19 Response
[/vc_column_text][vc_row_inner][vc_column_inner width=”1/2″][vc_column_text]

[/vc_column_text][/vc_column_inner][vc_column_inner width=”1/2″][vc_column_text]
[/vc_column_text][/vc_column_inner][/vc_row_inner][/vc_column][/vc_row][vc_row][vc_column width=”1/2″][vc_column_text]This report has been compiled by Ndevr Environmental Pty Ltd, using the latest information available from: AEMO, Office of the Chief Economist, Australian Petroleum Statistics and the Department of the Environment and Energy’s National Greenhouse Gas Inventory (NGGI) reports. Detailed electricity generation data for the National Energy Market (NEM) are sourced from Open NEM.
GDP trends are sourced from Trading Economics, information about Australian car use is sourced from the National Transport Commission, 2018 and the Australian Bureau of Statistics. Emission factors are sourced from National Greenhouse and Energy Reporting (Measurement) Determination 2008.
Government and CCA target information is available at the following sources:
[1] – Australian Government (2015), Australia’s 2030 Climate change target, Commonwealth of Australia
[2] – CCA (2014), Reducing Australia’s Greenhouse Gas Emissions – Targets and Progress Review, Final Report (page 9)
This work is copyright. Apart from any use permitted under the Copyright Act 1968, no part may be reproduced by any process, nor may any other exclusive right be exercised, without the permission of Ndevr Environmental, L2 27-31 King Street, Melbourne VIC 3000; 2020[/vc_column_text][/vc_column][vc_column width=”1/2″][vc_column_text]
We’re tracking Australia’s carbon budget, find out how we can help you monitor and reduce yours…
www.ndevrenvironmental.com.au
Ndevr Environmental is a specialist carbon, energy and sustainability focused consultancy firm that partners with clients to achieve positive business and environmental outcomes.
[/vc_column_text][vc_btn title=”Download PDF Version” i_icon_fontawesome=”fa fa-file-pdf-o” add_icon=”true” link=”url:https%3A%2F%2Fndevrenvironmental.com.au%2Fwp-content%2Fuploads%2F2020%2F06%2FTracking-2-Degrees-Report-FY2020-Q3-vA.0.pdf||target:%20_blank|”][/vc_column][/vc_row]