


[vc_row][vc_column][vc_column_text]
Tracking 2020 Q2 Report | or October, November and December 2019
[vc_row][vc_column][vc_column_text]
Under the Paris Agreement, the Australian Government has legally committed to reducing our emissions by 26-28% below 2005 levels by 2030. However, to ensure global warming remains under 2 degrees, independent body – the Climate Change Authority (CCA) – has proposed Australia set a national Science Based Target (SBT). This is a target calculated from Australia’s share of emissions for a 2◦C global outcome. Ndevr Environmental has used this target to model a quarterly emissions budget for Australia.
This report tracks Australia’s performance against our Paris target and the CCA’s carbon budget based on the latest available data, trends and industry movements for the months of October, November and December (Q2/FY2020). Our results are presented in tonnes of carbon dioxide equivalents (t CO2-e). 1 t CO2-e is roughly equal to the emissions of a standard 5-seat passenger vehicle driving around 5,400 km.[/vc_column_text][/vc_column][/vc_row][vc_row][vc_column][vc_column_text]
Headline Results
[/vc_column_text][/vc_column][/vc_row][vc_row][vc_column][vc_column_text]
- Emissions for the 12-month period to 31 December 2019 declined ever so slightly, by around 0.9% on the previous 12 months. This represents the first decline in calendar year annual emissions since 2015.
- If emissions continue to decline at a rate of 0.9% p.a., the 2030 Paris target would be met around 2095, 65 years after the deadline.
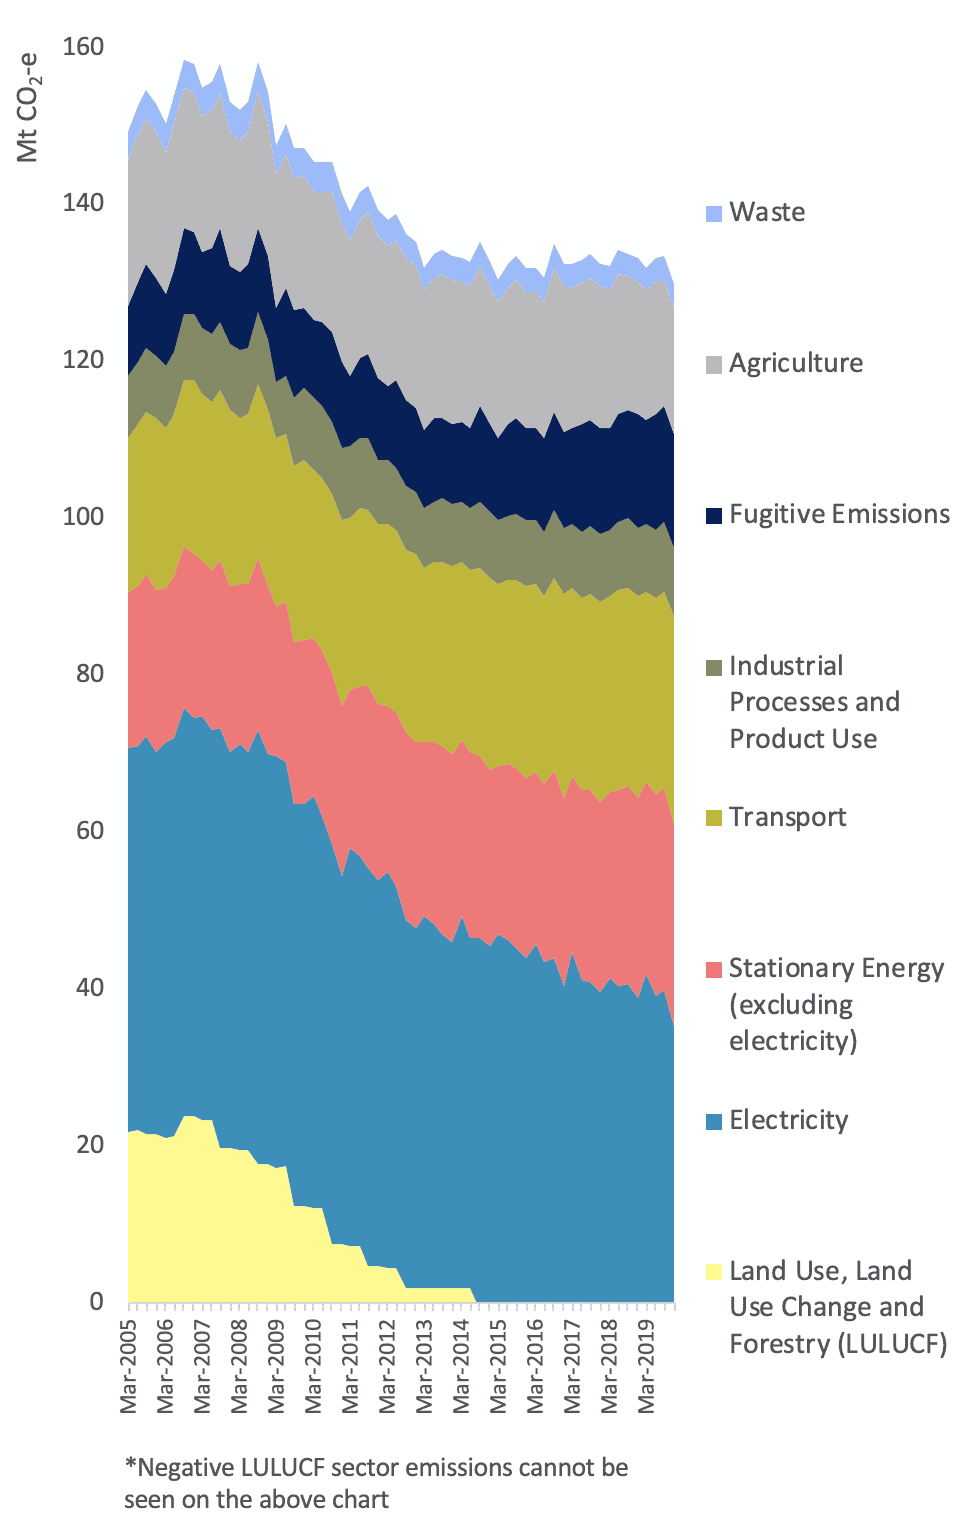
- While electricity emissions for Q2/FY2020 are the lowest on record (dating back to 2002), transport emissions are projected to be the highest on record.
- Renewable energy generation across the NEM states for the period had the highest penetration rate on record while black coal generation was at its lowest point in the data set (since 2005), totaling 25.2 TWh.
- Emissions for Q2/FY2020 are projected to be 129.8 Mt CO2-e. This represents a decline of 3.5 Mt CO2-e and a decline of 3.4 Mt CO2-e on the corresponding quarter the year prior (Q2/FY2019).
- We have undertaken some additional analysis for Q3/2020 in an attempt to understand the impact the COVID-19 crisis is having on domestic emissions. Electricity is the only current dataset and shows the slowing economy has apparently caused a slight decrease in electricity use.
- March 2020 consumption was 5% less than March 2019, and April is down around 2% on average daily consumption against the same period 12 months earlier.
- Our sources in the energy sector tell us electricity consumption in the commercial and industrial sectors has not softened as much as expected, declining only around 2 to 3% compared to projections of as much as 15 to 25% that were initially expected and based on the reductions seen in the UK and Italy.
- The electricity demand curve has flattened markedly, and the peaks that are usually seen between 6 to 10 pm are not as evident as much of the workforce has shifted from the office to the home.
[/vc_column_text][/vc_column][/vc_row][vc_row][vc_column][vc_column_text]
Australia’s Quarterly Emissions Projections to a 2 Degree Target
[/vc_column_text][/vc_column][/vc_row][vc_row][vc_column][vc_single_image image=”32121″ img_size=”full” alignment=”center”][vc_column_text]
Figure 1: Australia’s Quarterly Emissions Projections to a 2 Degree Target, 2005 – 2050
[/vc_column_text][vc_single_image image=”32040″ img_size=”full” alignment=”center”][vc_column_text]
Figure 2: Australia’s Quarterly Emissions Projections to a 2 Degree Target, 2013 – 2020
[/vc_column_text][/vc_column][/vc_row][vc_row][vc_column][vc_column_text]
Detailed Findings
[/vc_column_text][/vc_column][/vc_row][vc_row][vc_column][vc_column_text]
Increased Renewable Generation Leads to Reduced Electricity Emissions
The National Electricity Market has achieved its highest ever quarterly renewable energy penetration, coming in at 25.6%, representing a 1.6% increase on the previous high, which occurred last quarter. This contributed to a drop in electricity related emissions of 3.5 Mt CO2-e nationwide.
While total energy generation in the NEM has remained reasonably stable since 2005, rising renewable energy penetration has started to produce a downward trend in emissions from the Australian electricity sector.
[/vc_column_text][vc_single_image image=”32097″ img_size=”full” add_caption=”yes” alignment=”center”][/vc_column][/vc_row][vc_row][vc_column][vc_column_text]
Electricity Analysis for the National Energy Market

Electricity emission projections for Q2/FY2020 were the lowest on record across the entire data set, dating back to 2001 (39.2 Mt CO2-e).
With quarterly electricity demand relatively stable across the NEM, the decline has been driven by an increase in renewable energy generation from wind power, hydro power, utility-scale solar and rooftop solar. Renewable energy generation across the NEM states for the period was 25.6% (including rooftop solar), the highest penetration rate on record for renewable energy. Quarterly black coal generation was at its lowest point in three years, totalling 25.2 TWh.
For Q2/FY2020, results for the NEM states are as follows:
– NSW generated 16.6 TWh of electricity with 77% from black coal, 4% from gas and 19% from renewable sources including wind, hydro, utility-scale solar and rooftop solar. NSW’s renewable energy percentage is at an all-time high, up 3% on last quarter.
– QLD generated 16.2 TWh of electricity with 77% from black coal, 8% from gas and the balance from renewable sources including hydro, utility-scale solar, rooftop solar and a small portion of wind energy. QLD’s renewable energy percentage increased 2% on the previous quarter to reach an all-time high of 15%.
– VIC generated 11.5 TWh of electricity with 72% from brown coal, 5% from gas and 23% from renewable sources including wind, hydro, rooftop solar and utility-scale solar. Victoria’s rooftop and large-scale solar generation were both the highest on record.
– SA generated 3.6 TWh of electricity with 41% from gas and 59% from renewable sources such as wind, rooftop solar, utility-scale solar and battery (discharge). South Australia’s renewable energy percentage has risen 8% on last quarter to reach its highest on record.
– TAS generated 2.5 TWh of electricity with 98% from renewable sources such as hydro, wind and rooftop soar and the balance from gas. TAS’s renewable energy percentage has not dropped below 78% since records began (2005).[/vc_column_text][vc_row_inner][vc_column_inner][vc_column_text]

[/vc_column_text][/vc_column_inner][/vc_row_inner][/vc_column][/vc_row][vc_row][vc_column][vc_row_inner][vc_column_inner width=”1/2″][vc_column_text]
Australia’s Quarterly Emissions By Sector
[/vc_column_text][vc_column_text]
[/vc_column_text][/vc_column_inner][vc_column_inner width=”1/2″][vc_column_text]
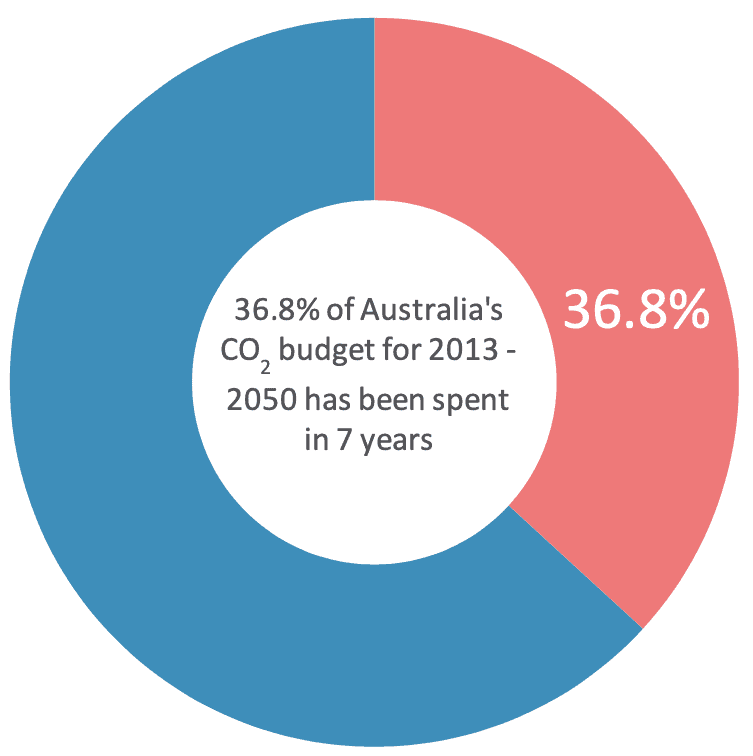
2 Degree Budget Expenditure to Date
[/vc_column_text][vc_column_text]
[/vc_column_text][/vc_column_inner][/vc_row_inner][vc_column_text]
Real-world Effects – COVID-19 Response
Based on available data it is too soon to determine the effects the COVID-19 pandemic is having on emissions across the country. That begin said, the slowing of the economy appears to be showing a slight decrease in electricity consumption. March 2020 consumption was 5% less than March 2019, however it should be noted that March 2019 was generally warmer. April 2020 (month to date) is down around 2% on average daily use against the corresponding period. Figures 8 and 9 below show the results.
Our contacts in the energy sector tell us that overall electricity consumption has not decreased as much as they expected, and commercial and industrial consumption is only down around 2 to 3%. The daily demand curve has flattened, and the 6 to 10 pm spikes that are often seen in normal circumstances are not as pronounced. This is in line with the fact that much of the workforce is currently working from home.[/vc_column_text][vc_row_inner][vc_column_inner width=”1/2″][vc_column_text]

[/vc_column_text][/vc_column_inner][vc_column_inner width=”1/2″][vc_column_text]

[/vc_column_text][/vc_column_inner][/vc_row_inner][/vc_column][vc_column][vc_column_text]In our next quarterly report (data ends March 2020, report due mid-May) we expect emissions will drop markedly across the economy. At a more granular level, we may expect to see:
- sharp decreases in liquid fuel emissions from air and sea transport,
- reduced emissions from land transport as passenger commutes have decreased – we understand retail fuel sales have dropped dramatically although we are yet to see the dataset; and
- a marginal reduction in electricity consumption.
[/vc_column_text][/vc_column][/vc_row][vc_row][vc_column width=”1/2″][vc_column_text]This report has been compiled by Ndevr Environmental Pty Ltd, using the latest information available from: AEMO, Office of the Chief Economist, Australian Petroleum Statistics and the Department of the Environment and Energy’s National Greenhouse Gas Inventory (NGGI) reports. Detailed electricity generation data for the National Energy Market (NEM) are sourced from Open NEM.
GDP trends are sourced from Trading Economics, information about Australian car use is sourced from the National Transport Commission, 2018 and the Australian Bureau of Statistics. Emission factors are sourced from National Greenhouse and Energy Reporting (Measurement) Determination 2008.
Government and CCA target information is available at the following sources:
[1] – Australian Government (2015), Australia’s 2030 Climate change target, Commonwealth of Australia
[2] – CCA (2014), Reducing Australia’s Greenhouse Gas Emissions – Targets and Progress Review, Final Report (page 9)
This work is copyright. Apart from any use permitted under the Copyright Act 1968, no part may be reproduced by any process, nor may any other exclusive right be exercised, without the permission of Ndevr Environmental, L2 27-31 King Street, Melbourne VIC 3000; 2020[/vc_column_text][/vc_column][vc_column width=”1/2″][vc_column_text]
We’re tracking Australia’s carbon budget, find out how we can help you monitor and reduce yours…
www.ndevrenvironmental.com.au
Ndevr Environmental is a specialist carbon, energy and sustainability focused consultancy firm that partners with clients to achieve positive business and environmental outcomes.
[/vc_column_text][vc_btn title=”Download PDF Version” i_icon_fontawesome=”fa fa-file-pdf-o” add_icon=”true” link=”url:https%3A%2F%2Fndevrenvironmental.com.au%2Fwp-content%2Fuploads%2F2020%2F05%2FTracking-2-Degrees-Report-FY2020-Q2-vA.4.pdf||target:%20_blank|”][/vc_column][/vc_row]