


Tracking 2019 Q4 Report | or April, May and June 2019
Under the Paris Agreement, the Australian Government has legally committed to reducing our emissions by 26-28% below 2005 levels by 2030. However, to ensure global warming remains under 2 degrees, independent body – the Climate Change Authority (CCA) – has proposed Australia set a national Science Based Target (SBT). This is a target calculated from Australia’s share of emissions for a 2◦C global outcome. Ndevr Environmental has used this target to model a quarterly emissions budget for Australia.
This report tracks Australia’s performance against our Paris target and the CCA’s carbon budget based on the latest available data, trends and industry movements for the months of April, May and June (Q4/FY2019). Our results are presented in tonnes of carbon dioxide equivalents (t CO2-e). 1 t CO2-e is roughly equal to the emissions of a standard 5-seat passenger vehicle driving around 5,400 km.
Headline Results
- Australia’s national emissions for FY2019 are projected to increase ever so slightly on the previous year (0.1%), marking the third year of consecutive increases.
- For FY2019, falls in electricity and agricultural emissions were offset by increases in stationary energy and fugitive emissions with all other sectors remaining relatively stable.
- On the current trajectory Australia will overshoot the 2030 Paris target cumulatively by around 860 Mt CO2-e. This is equal to 1.6 years of Australia’s entire nation wide carbon emissions.
- Emissions for Q4/FY2019 are projected to be 134.6 Mt CO2-e, this is an increase of 0.9 Mt CO2-e on the previous quarter but a decline of 0.8 Mt CO2-e on the same quarter the year prior (Q4/FY2018).
- This quarter’s Climate Champion is MSM Milling, who will save around 80,000 t CO2-e over 20 years by implementing a renewable energy powered biomass boiler. Commissioned early in 2019, they have also saved around 60-70% on their thermal energy costs.
Detailed Findings
Annual Emission Trends

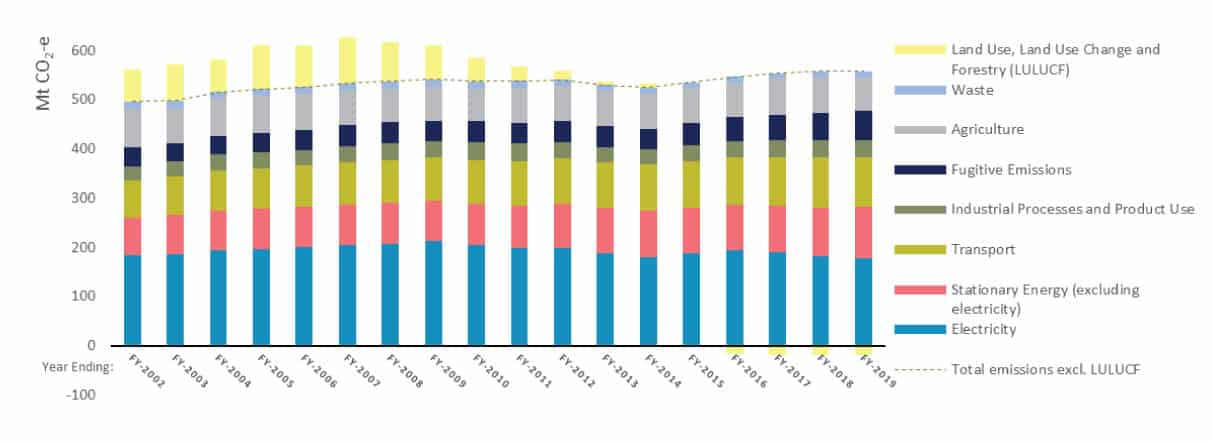
Australia’s national emissions for FY2019 are projected to increase marginally on the previous year (0.1%) marking the third year of consecutive increases. When excluding land use emissions, FY2019 marks the fifth consecutive year of increases. Despite annual emission increases occurring at declining rates over time, Australia remains on track to overshoot the Paris target by 25 – 29% in 2030.
Figure 3 shows that the last period of emissions decline was FY2012 – FY2014 when the carbon price was in effect. Since the adoption of the Emission Reduction Fund, to be rebranded as the Climate Solutions Fund, emissions have increased ever year through to FY2019.
Declining Electricity Sector Emissions Offset by Other Sectors
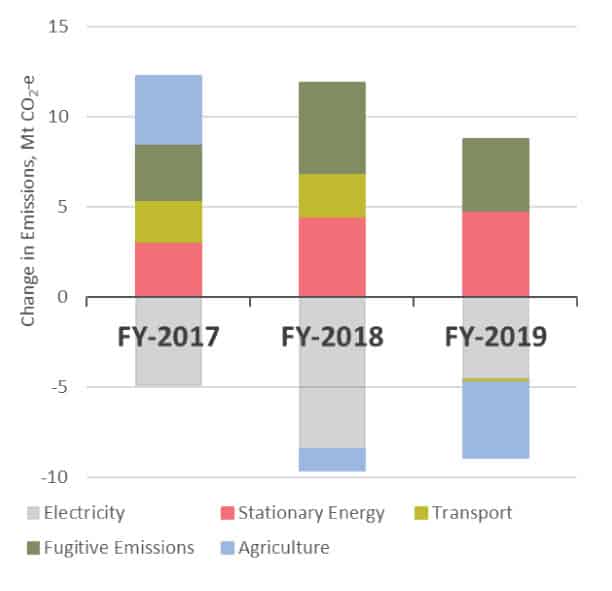 Figure 4 shows that Australia’s national electricity emissions have decreased for three consecutive years:
FY2017: the decline in electricity emissions was entirely offset by other energy sectors and agriculture;
FY2018: the decline in electricity and agricultural emissions was entirely offset by emissions in other energy sectors
FY2019: the decline in electricity, transport (marginal change) and agriculture were offset by remaining energy sectors, stationary energy (excluding electricity production) and fugitive emissions. Stationary energy and fugitive emissions have been increasing rapidly with increased production of Liquefied Natural Gas (LNG) for the international export market.
Increased renewable energy generation is the key factor leading to the decline in electricity sector emissions while agricultural emissions have declined due to significant droughts around Australia creating poor grazing conditions . Declining electricity and agricultural emissions have not yet outpaced increases in other sources of emissions throughout the Australian economy.
Figure 4: Annual Change in Emissions for Variable Emission Sector
Electricity Analysis for the National Energy Market

Electricity emission projections for Q4/FY2019 were the second lowest recorded across the entire data set (43.5 Mt CO2-e) with the lowest being recorded in Q2/FY2019 (42.9 Mt CO2-e).
With quarterly electricity demand relatively stable across the NEM, the decline has been driven by an increase in renewable energy generation from wind power, hydro power, utility-scale solar and rooftop solar. Renewable energy generation across the NEM states for the period was 21% (including rooftop solar) and is on track to increase in the following quarter to 24%, with generation from wind and utility scale solar reaching new highs.
For Q4/FY2019, results for the NEM states are as follows (note: renewable energy percentages now include rooftop solar generation):
– NSW generated 17.0 TWh of electricity with 85% from black coal, 1% from gas and 14% from renewable sources including wind, hydro, utility-scale solar and rooftop solar. NSW’s renewable energy percentage has averaged 14% for FY2019 up from 11% for FY2018.
– QLD generated 15.3 TWh of electricity with 81% from black coal, 8% from gas and the balance from renewable sources including hydro, utility-scale solar, rooftop solar and a small portion of wind energy. QLD’s renewable energy percentage increased on the previous quarter to reach an all-time high of 10.8%.
– VIC generated 11.3 TWh of electricity with 73% from brown coal, 7% from gas and 20% from renewable sources including wind, hydro, rooftop solar and utility-scale solar. Victoria’s renewable energy percentage averaged 20% for FY2019 up from 17% in FY2018.
– SA generated 3.6 TWh of electricity with 52% from gas and 48% from renewable sources such as wind, rooftop solar, utility-scale solar and battery (discharge). SA’s renewable energy percentage averaged 52% in FY2019 up from 48% in FY2018.
– TAS generated 2.8 TWh of electricity with 93% from renewable sources such as hydro, wind and rooftop soar and the balance from gas. TAS’s renewable energy percentage averaged 95% in FY2019 up from 92% in FY2018.
Ndevr Environmental’s Climate Champion
Our Tracking 2 Degrees report tracks Australia’s carbon emissions against our international Paris Agreement commitments. While more substantial and immediate efforts are required for Australia to meet emission reduction commitments, Australian businesses, councils and states nationwide are sending a strong message by taking the lead in sustainability initiatives and climate action. Ndevr Environmental’s Tracking 2 Degrees reports will recognise and commend Australia’s ‘Climate Champions’ for their significant contribution to emission reductions and sustainability practices and initiatives. The Climate Champion this quarter is MSM Milling Pty Ltd.
About MSM Milling
MSM Milling is based in Manildra, New South Wales, and processes canola seed into oil, meal and stock feed products. The canola seeds are sourced directly from local farmers and the end products are sold to a range of consumers from major food manufacturers to retailers to stock feeders.
Biomass Fuel Switch Project
In 2015, Ndevr Environmental was engaged to assess emissions reduction potential of a potential biomass fuel switch. In 2018, we assisted MSM Milling in securing a $2 million grant from the Australian Renewable Energy Agency (ARENA) to fund MSM Milling Biomass Fuel Switch Project. The project, which had a total installation cost of $5.38 million, involved replacing MSM Milling’s LPG-fired boiler array with a 5 MW biomass boiler which would source its fuel from renewable locally sourced timber waste.
The Fuel Switch Project will result in carbon abatement of approximately 4,000 tCO2-e per annum, and over 80,000 tCO2-e over the life of the project.
In addition, the project will save thousands of dollars in operational costs and generate carbon credits saleable through the Emissions Reduction Fund. MSM Milling’s project is one of the first thermal energy biomass applications for a large-scale food manufacturing operation. The biomass boiler will produce steam outputs of up to 4,147 kg/h, which will be utilised in MSM Milling’s operations. Not only will the project reduce greenhouse gas emissions, it will also reduce fossil depletion and fossil energy use and create value from a resource stream traditionally considered to be waste.
Project Operation
MSM Milling’s biomass boiler has been operational as of January 2019 and currently operates above the NSW Environment Protection Authority’s efficiency standards. The fuel source for the boiler is locally and sustainably sourced timber waste and includes a mixture of bark, sawdust, wood grindings and fines, with approximately 5,000 tonnes of this biomass required per annum.
MSM Milling received a commendation during the 2018 Bioenergy Innovation Awards in Brisbane for its Biomass Fuel Switch Project.
Australia’s Quarterly Emissions By Sector

2 Degree Budget Expenditure to Date

This report has been compiled by Ndevr Environmental Pty Ltd, using the latest information available from: AEMO, Office of the Chief Economist, Australian Petroleum Statistics and the Department of the Environment and Energy’s National Greenhouse Gas Inventory (NGGI) reports. Detailed electricity generation data for the National Energy Market (NEM) are sourced from Open NEM.
GDP trends are sourced from Trading Economics, information about Australian car use is sourced from the National Transport Commission, 2018 and the Australian Bureau of Statistics. Emission factors are sourced from National Greenhouse and Energy Reporting (Measurement) Determination 2008.
Government and CCA target information is available at the following sources:
[1] – Australian Government (2015), Australia’s 2030 Climate change target, Commonwealth of Australia
[2] – CCA (2014), Reducing Australia’s Greenhouse Gas Emissions – Targets and Progress Review, Final Report (page 9)
This work is copyright. Apart from any use permitted under the Copyright Act 1968, no part may be reproduced by any process, nor may any other exclusive right be exercised, without the permission of Ndevr Environmental, L2 27-31 King Street, Melbourne VIC 3000; 2017